Chapter 17. Determining a Rate Law and Rate Constant
Discussion
Objectives
- Understand the similarities and differences between zero-, first-, and second- order rate laws.
- Use absorbance measurements to track the completion of a reaction over time.
- Use data analysis and graphing techniques to determine a rate law and rate constant for a reaction.
Introduction
Chemical kinetics is the study of the speed, or rate, of reactions. We know that some reactions happen faster than others. The addition of baking soda to vinegar produces a quick reaction that we see almost instantly. Contrarily, rust forming on our cars is a very slow reaction and not something that we will notice in minutes. It is often advantageous for scientists to know the speed of reactions. Pharmaceutical researchers, for example, must know how fast a drug will work when it enters the body. In this lab you will study chemical kinetics. We will use absorbance measurements to track the progress of a reaction as a function of time and determine a rate law and rate constant for a chemical reaction.
Connection to Lecture
The rate of a reaction is the change in concentration with a change in time. The rate generally depends on the concentration of reactants. The rate law is a mathematical expression of how the rate changes with changing concentration. For a general reaction represented below,
a A + b B → products
the rate law has the form
rate = [A]x[B]y
where square brackets indicate molar concentrations of reactants A and B
x is the order with respect to A
y is the order with respect to B
k is the rate constant, a proportionality constant between rate and concentration terms.
Values of x, y, and k can only be determined from experiment. Determining the values of x and y establishes the rate law. You will determine the rate law and the rate constant for a particular reaction in this experiment.
Conditions in this experiment allow us to study the effect of concentration of just one reactant on the rate.
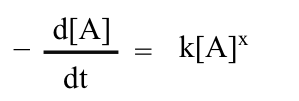
Rate = k[A]x
The rate is the change in concentration with a change in time and can be expressed as

The negative sign arises because the concentration of A is decreasing (a negative change in concentration). What we are really interested in is the instantaneous change in concentration, which is the limit as the time interval Δt approaches zero. This is the derivative of [A] with respect to time.
Determining Rate Order
First order
If x = 1, the above equation is a first order rate law. Rearranging the first order expression produces

Integration from time 0 to time t gives

where [A]t is the concentration of reactant A at time t and [A]0 is concentration of A at time t=0. This equation can be rearranged
so that it has the form of an equation of a straight line.
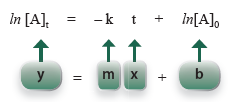
For a fi rst order process, a graph of the natural log of concentration of A at time t, ln [A]t , versus time, t, will be a straight line.
Question 16.1: For a first order process a graph of ln [A]t versus t will give a straight line. What is the slope and y-intercept of this line?
Second order
Similarly, a second-order rate of the form
rate = k[A]2
can be written, rearranged, and integrated as follows.
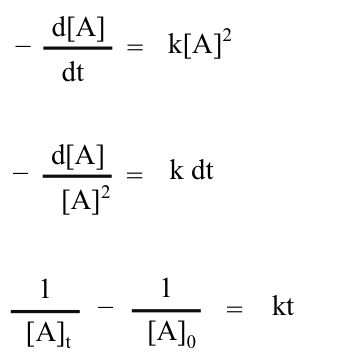
Again, a rearrangement produces the form of an equation of a straight line.
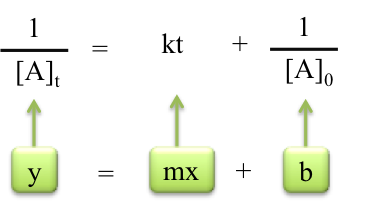
A graph of (1/ [A]t) versus t is a second order graph. It will be a straight line if the reaction is second order.
Question 16.2: What is the slope and y-intercept for a second order plot?
Zero order
In some cases, rate does not depend on concentration.

Rearrangement and integration here produce
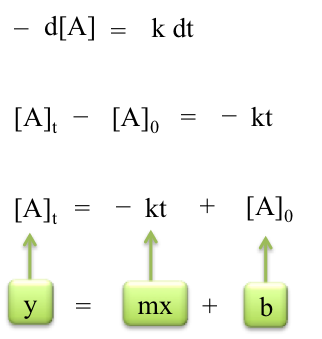
A graph of concentration at time t versus time is a straight line for a zero-order reaction.
Question 16.3: What is the slope and y-intercept of the line for a zero order plot?
Determining Rate Constant, k
If we consider a reaction that has one of these three rate laws, we can determine the rate law (the order with respect to A) by drawing zero-order, first-order, and second-order graphs. Only one of these graphs will be a straight line. The graph with the straight line establishes the order of the reaction and the rate law.
Once the rate law is established, the rate constant for the reaction can be determined from the same graph. Looking back at the linear integrated equation for each order, you will notice that the slope equals the negative of the rate constant, -k, for both a zero-order and first-order graph. For a second order graph, slope = k. Graphical determination of the slope establishes the rate constant.
Reaction for this Lab
The reaction you are studying is between Cr3+ ion and dihydrogen ethylenediaminetetra-acetate, H2EDTA2- in aqueous solution. The reaction can be represented as follows.
Cr(H2O)63+ + H2EDTA2− → CrEDTA− + 2 H3O+ + 4 H2O
Ethylenediaminetetraacetic acid is a large molecule with the structure shown below.

The four terminal hydrogen atoms, circled, are acidic; removal of two of them produces H2EDTA2−, the reactant in this experiment. The EDTA4− ion effectively wraps itself around a Cr3+ ion, bonding through four oxygen atoms (two on each end) and the two nitrogen atoms.
The effect of changing concentration of Cr3+ on the rate of the reaction will be studied. The rate of this reaction also depends on H2EDTA2− and H3O+ concentrations, but conditions are arranged so that you will not see that dependence. An approximately fifty times excess of H2EDTA2-− is used so that its concentration is essentially constant. In addition, the excess H2EDTA2− will react with the hydronium ion produced in the reaction keeping the pH nearly constant.
Absorbance measurements
In order to determine a rate law and rate constant, we must be able to measure concentration of a reactant or product during the course of the reaction, while it is changing. In this experiment, the chromium-containing reactant and product are different colors: Cr(H2O)63+ is rose and CrEDTA−is purple. A spectrophotometer can be used to measure the absorbance, A, which is directly proportional to concentration, c.
A α c
The proportionality constant is represented by ϵb where ϵ is the molar absorptivity and b is the path length of light through the solution. The relationship is known as Beer's Law.
A = ϵbc = mc = m[CrEDTA−]

Different colored species absorb at different wavelengths. We are using a wavelength of 545 nm, at which the CrEDTA− product absorbs strongly. Absorbance will increase during the course of the reaction as the CrEDTA− is produced.
The procedure has three parts:
- Preparation of solutions
- Measurement of absorbance as a function of time
- Measurement of absorbance at completion of reaction
Four solutions are prepared with different concentrations as Cr3+ ion. These will provide data for four determinations of the rate constant. Be sure to note time of mixing for each solution – this is time t = 0.
The absorbance is read for each solution at five-minute intervals. Temperature is held constant by placing cuvettes containing the solution in a water bath between readings. The temperature of the water bath is maintained between 24 and 25 degrees Celsius.
To determine absorbance at the completion of the reaction, a portion of each solution is heated for several minutes in a boiling water bath. The higher temperature increases the rate so that reaction is complete in a relatively short time. Therefore the final concentration of the CrEDTA- product will be equal to the initial concentration of the Cr3+ reactant. The proportionality constant can then be determined from the slope of a Beer's Law graph.
Data analysis
You should use a graphing program, e.g. Excel, for your calculations and graphs. Construct a table of your data, like the one shown on the last page of the report sheet, for each solution 1 through 4. Data of “Time” and “A” will be collected in lab, and the other columns of “[CrEDTA−]t,” “[Cr3+]t,” “ln [Cr3+]t” and “1/[Cr3+]t” will be calculated.
Four graphs will be constructed:
Beer’s Law (Graph 1)
In the four boiled solutions, reaction ahs gone to completion so all of the chromium is present as the product, CrEDTA−. Calculated the final molar concentration of CrEDTA− by using molarity and volumes in the original solution, [Cr3+]0. This is a dilution calculation. Construct a Beer’s Law plot by graphing absorbance (y-axis) versus concentration (x-axis) for these four solutions (Graph 1). Your line should go through the origin. Determine the slope of the line, m, which is equal to the proportionality constant, ϵb.
Use your Beer’s law graph and absorbance values to determine [CrEDTA−]t. This value is subtracted from total chromium to obtain concentration of unreacted chromium(III), [Cr3+]t, at each time.
[Cr3+]t = [Cr3+]0 + [CrEDTA−]t
Zero order (Graph 2)
Construct a zero order graph by plotting [Cr3+]t versus t, for each solution. Include all four solution plots on the same graph.
First order (Graph 3)
Construct a first order graph by plotting ln [Cr3+]t versus t, for each solution. Include all four solution plots on the same graph.
Second order (Graph 4)
Construct a second order graph by plotting 1 / [Cr3+]t versus t, for each solution. Include all four solution plots on the same graph
Select the type of graph (of graphs 2, 3 or 4) for which the curve is most nearly a straight line. Use linear trend lines for each data set. Set the options to include the line equations and R2 values. However, do not use the R2 values to determine the reaction order. Instead, look at the lines on graphs 2, 3 and 4 and choose the graph (order) for which the lines are the most parallel. Report this reaction order on your report sheet.
The rate constant
Use the graph you selected as your reaction order to determine the rate constant. The rate constant will be the slope of the line and should be the same for all four solutions. Calculate the average rate constant and average deviation. Include all of these on your report sheet.
If this experiment is performed in groups, recording of data is done together in the lab. ALL calculations, graphs and other parts of the report must be completed individually.
Materials Required
Equipment
- 25-mL buret, clamp
- 10-mL pipet
- eight 75-mL test tubes
- water bath (100-mL beaker)
- water bath (400-mL beaker)
- Bunsen burner, wire gauze
- thin-walled rubber tubing
- ring stand, ring
- thermometer
Chemicals
- 0.0200 M chromium(III) nitrate, Cr(NO3)3
- 0.200 M disodium dihydrogen ethylenediaminetetraacetate, Na2H2EDTA
Common Equipment
- five cuvettes
- Jenway 6320D spectrophotometer
- Kimwipes
Cautions
Be careful to avoid burns from the ring, beaker and the open flame. Salts of Cr3+ are toxic; be sure to wash your hand thoroughly. Goggles must be worn at all times.
Procedures
Discussions with your peers and TA are encouraged as you proceed.
- Set up a water bath using a 400-mL beaker, and start heating the water. A second water bath using the 100-mL beaker will be maintained at close to 25°C—place a large rubber stopper in the bottom of the 100-mL beaker as a base for the cuvettes.
- Label four clean, dry 75-mL test tubes 1 through 4. Clean the 25-mL buret and fill it with 0.0200 M Cr(NO3)3. Add the amount of Cr(NO3)3 solution listed in Table 16.1 for each solution to the corresponding numbered test tube.
| Solution | 0.0200 M Cr(NO3)3 | 0.0200 M Na2H2EDTA |
|---|---|---|
| 1 | 4.00 mL | 20.00 mL |
| 2 | 4.50 mL | 20.00 mL |
| 3 | 5.00 mL | 20.00 mL |
| 4 | 5.50 mL | 20.00 mL |
- Pipet 20.00 mL of the 0.200 M Na2H2EDTA solution into each of the additional four clean, dry 75-mL test tubes.
- Set the wavelength on the Jenway 6320D to 545 nm and calibrate to zero absorbance using a “blank”—a cuvette containing only Na2H2EDTA solution. Label the remaining four cuvettes 1 through 4 (use a marking pen on a side of the cuvette that is cloudy). Make sure the number faces towards you when the cuvette is placed in the spectrophotometer which ensures that the beam passes from left to right through the clear faces of the cuvette.
Measurement of absorbance as a function of time.
- Carefully pour the Cr(NO3)3 solution from the test tube 1 into any test tube containing 20.00 mL of Na2H2EDTA solution. Swirl the solution, and then pour the resulting solution back into test tube 1. This process will quickly and thoroughly mix the solutions. Record the time of the mixing as the first contact of the two solutions. Use the solution to rinse and fill cuvette 1 about ¾ full. Wipe the outside of the cuvette with a Kimwipe and take an absorbance reading. No more than a minute or two should elapse between mixing (t = 0) and the first absorbance reading. Place the cuvette containing solution 1 in the water bath at about 25 °C. Place the test tube containing the remaining solution in the hot water bath.
- Repeat step 5 for solutions 2, 3 and 4. Each solution is mixed in the minutes between readings of previously mixed solutions.
- Test tubes containing the remaining solutions will be used in step 10 and should be heated in a bath of boiling water for 10 minutes while proceeding with the following steps.
- Take readings every 5 minutes for each cuvette. You may need to take a second reading on solution 1 before all solutions are mixed. Stagger the readings for the four solutions so that readings are taken every minute. Periodically check that the background reading is still zero for the blank during the “free” minute. Between readings, place the cuvettes in a water bath maintained between 24 and 25°C.
- Continue taking readings for at least 75 minutes. The final absorbance readings should all exceed 0.4.
Measurement of absorbance at completion of reaction.
- If the solutions in the four test tubes did not turn dark purple upon heating for 10 minutes, consult your lab instructor.
- The boiled solutions should be at room temperature before taking any readings. Tilt each test tube to return drops of water on the walls of the test tube to the solution, refill up to the mark (from Step 5) with distilled water and stir. Rinse and fill the cuvettes ¾ full from each labeled test tube in turn. Take an absorbance reading for each solution.
- Construct a trial Beer’s Law graph on paper, to be checked by your lab instructor before leaving.
Waste Disposal
All solutions containing Cr3+ ion must be collected and added to the inorganic salts waste beaker. Fill in the waste disposal sheet. Your lab instructor will dispose of the total volume in the appropriate container.
17.1 New Section
Prelab:
Read the lab and watch the corresponding video. Take the online quiz for this lab BEFORE your scheduled lab time.
During:
Complete the lab as outlined in the procedure. Be certain to collect all data in the time allotted and answer the questions using your laboratory notebook. Turn your carbon copies in to you TA.
If time permits do your calculations during lab before you leave.
If you are unable to fully complete the lab notify your TA and plan to finish it at a later date, within your lab time.
Postlab:
Prepare a report to turn in, due one week from completion of this lab, to your TA. The report should include:
- Title, Date and Authors (Your name and your TA’s name)
- Purpose
- Brief experimental section
- Results and Discussion (see below for guidelines)
- Conclusion (see below for guidelines)
Results
Attach your completed report sheet to your lab report. Include printouts of the 4 tables similar to the one shown on the report sheet and the 4 graphs constructed. Be sure to clearly indicate which graph corresponds to the order of your reaction. Show any necessary calculations; the calculations may be written by hand.
Discussion
In this analysis you are constructing graphs for a zero, first and second order rate law. You will use this graph to determine the rate constant.
- Explain which order you determined your reaction to be. Indicate which graph (2, 3 or 4) supports this and why you chose it.
- Report what rate constant you calculated and if this makes sense.
- Discuss if the reaction rates for the four solutions were similar.
- Discuss any errors associated with this lab and how they would impact your results.
Conclusion
Specifically mention the order you determined for your reaction and what plot supports this decision. Also report the average rate constant and deviation. Lastly comment on any known errors associated with this lab. For the final statement you should tell the reader what your results mean in the context with which chemical kinetics has been discussed in the text and lecture.
Activity Completed!
Activity results are being submitted...